An atom’s electron can absorb or radiate the energy of a specific wavelength, which can be recorded as atomic spectra in the form of bands or lines. The spectra, in fact, are energy deals of electrons. Due to their distinct orbitals or energy levels, all atoms produce line spectra or discontinuous spectra. A dark area separates these spectral lines from one another.
There are two types of atomic spectra:
Absorption spectra
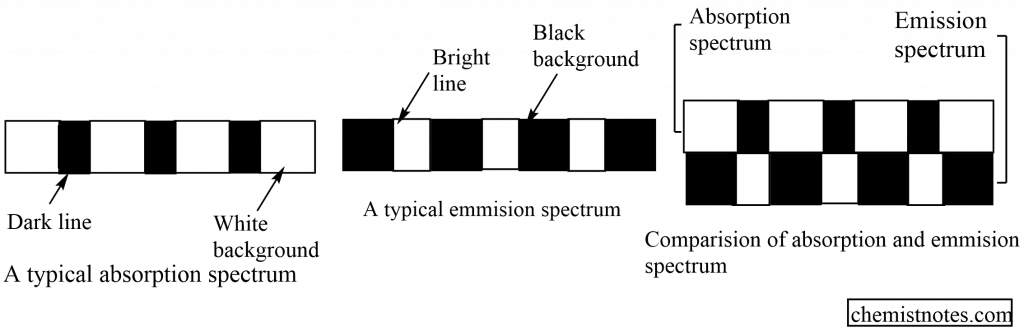
When an atom in its vapor state is placed in white light, it absorbs light of characteristic wavelength due to the electrons present in it. The light of other wavelengths gets transmitted. This behavior of atoms produces a series of dark lines on a background called atomic absorption spectra.
Emission spectra
When an atom in its vapor state is heated to a high temperature, the electrons get excited. When the heating is turned off, the atoms revert to their ground state by emitting radiation of a specific wavelength. The emitted radiations resulted in a series of bright lines on a dark background, which is known as an emission spectrum.
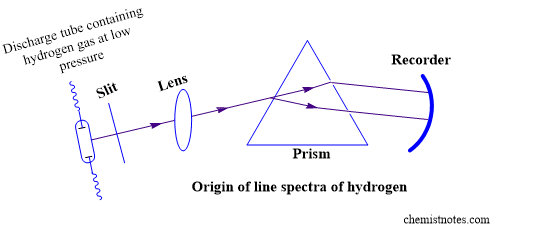
Each line in the absorption or emission spectra corresponds to a specific wavelength of radiation, therefore no two elements have the same pattern of spectral lines in the absorption or emission spectra. As a result, these spectra are effective tools for identifying elements. A spectroscope is used to record these spectra.
When absorption and emission spectra of the same element are compared, the dark lines of absorption and bright lines of emission spectra appear at the wavelength.
Explanation of hydrogen spectra on the basis of Bohr’s atomic model
The hydrogen atom produces five series of line spectra that can be described using Bohr’s atomic theory. An atom, according to Bohr’s atomic theory, has multiple orbits with different energies. Electrons in these orbits may absorb energy, be promoted to higher energy levels, and then radiate the absorbed energy at a characteristic wavelength. Hydrogen gives absorption as well as emission spectra. When hydrogen is subjected to an electric discharge at high voltage and low pressure, the molecules are first dissociated into atoms, and then electrons are promoted to higher energy levels depending on the amount of energy absorbed. Because the excited electron is not stable, it returns to lower energy levels by emitting radiations in jumps, giving rise to line spectra. Based on the wavelength of energy emitted, i.e. the difference between higher and lower energy levels, five types of spectral series are found for hydrogen.
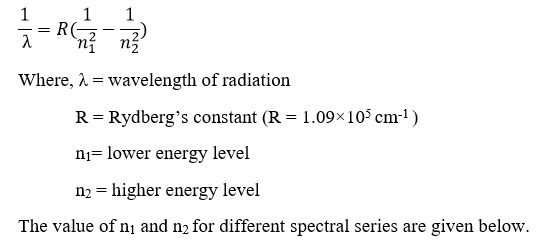
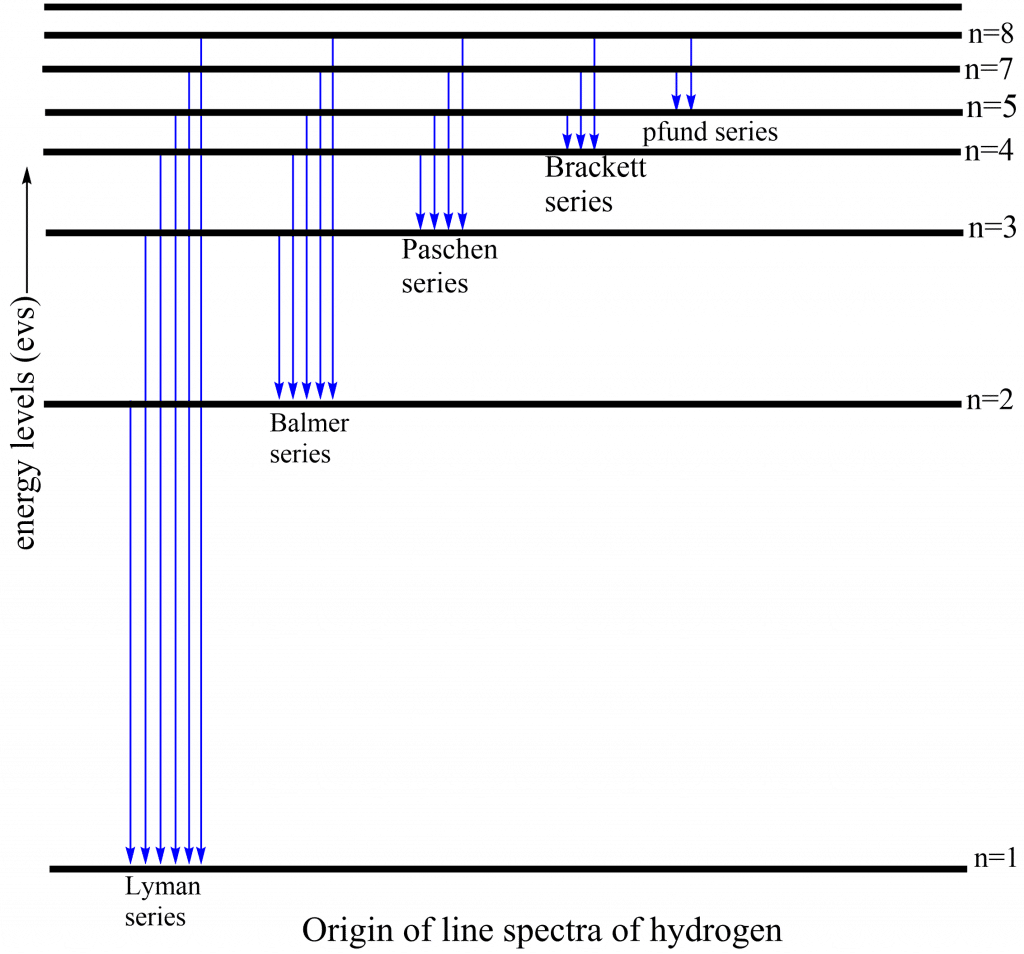
Because the hydrogen atom has an infinite number of unoccupied orbits, the excited electron can return to 1,2,3,4, or 5 orbits, giving birth to the Lyman series, Balmer series, Paschen series, Bracket series, and Pfund series. In general, the wavelength of emission may be estimated using the Balmer equation. From the Lyman series to the Pfund series, the wavelength increases from 1000Ao to 50,000Ao.
Spectral Series
| Spectral series | n1 | n2 | spectral region |
| Lyman series | 1 | 2,3,4,… | ultraviolet |
| Balmer series | 2 | 3,4,5,… | visible |
| Paschen series | 3 | 4,5,6,… | infrared |
| Bracket series | 4 | 5,6,7,… | infrared |
| Pfund series | 5 | 6,7,8,… | far-infrared |
The electronic transition which produces different series of spectral lines in hydrogen spectra are shown as below:
References
- Atkins, P. (2010). Shriver & Atkins’ Inorganic Chemistry (5th or later Edition). Oxford University Press.
- Lee, J. D. (2008). Concise Inorganic Chemistry: Fifth Edition by J.D. Lee (Fifth edition). Oxford University Press.

One Response
according to lamda, in the hydrogen emission spectrum, how can we calculate the energy gap between Barmer 2 and 3 lines and paschen 1 and 2 lines ? the energy gap equal or not?