Table of Contents
ToggleOptical Rotatory Dispersion (ORD) is the measure of the rate at which a certain rotation varies with respect to wavelength. Light rotates specifically and absorbs differently depending on wavelength. ORD is the difference in optical rotation in a dissymmetric medium caused by a change in anisotropic radiation’s wavelength. As the wavelength decreases, the rotation’s absolute value increases.
Optical Rotatory Dispersion Definition
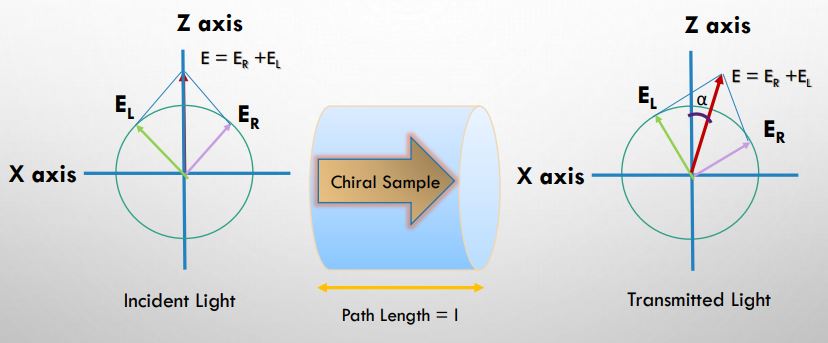
Optical Rotatory Dispersion and Circular dichroism spectroscopy are useful tools for resolving stereochemical issues in the steroid research. It has been demonstrated that a key characteristic of an optically active material is that it has distinct refractive indices for the left and right circularly polarized light, nL and nR, respectively. This is because the speed of light in a medium is represented by the medium’s refractive index. Due to the different angles that EL and ER create with the Z axis, an optically active medium rotates the plane of polarization.
The anomaly in the Optical rotatory dispersion (ORD) curve when the wavelength tends toward the UV region is known as the Cotton effect. Cotton effect is also the result of the combination of Circular dichroism and Circular birefringence. The change of optical rotation with the wavelength so called ORD and the curve obtained are called Cotton curve.

Principle of ORD
Optically active chemicals are those that have the capacity to rotate the plane of polarized light. Optically active substances have this characteristic. Polarimeter is used to measure it. In the wavelength range of optically active compounds, a phenomenon known as circular dichroism (CD) occurs when the amount of absorption of left and right circularly polarized light varies.
By shining left and right circularly polarized light through an optically active material, CD measurements may identify these variations. The resulting elliptically polarization of the transmitted light is known as circular dichroism (CD).
Classification of Optical Rotatory Dispersion Curve
The optical rotatory dispersion curve are classified into two main types and they are:
- Plain curve
- Cotton effect Curve
- Plain curve
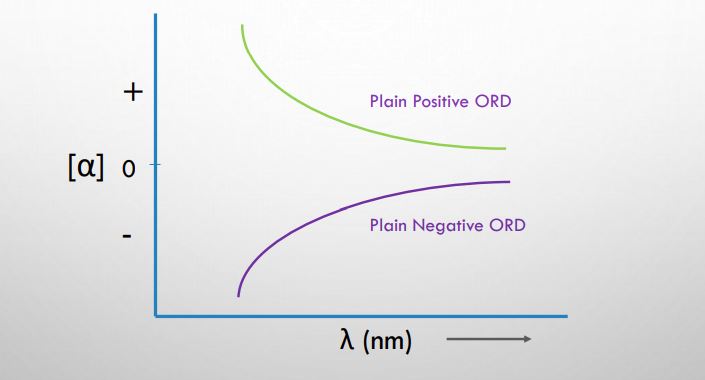
Plain curve: The term “plain curve” refers to an optical rotation that steadily increases or decreases as wavelengths away from the maximum absorption wavelength, crossing or not crossing the zero rotation line. When the rotation increases as the wavelength decreases, the curve is termed positive; when the rotation decreases as the wavelength decreases, the curve is called negative.
2. Cotton effect curve
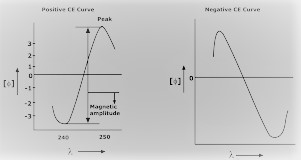
Cotton effect curves are also known as anomalous dispersion of optical rotation. Cotton effect curves are obtained for the compound with asymmetric carbon and chromophore which absorbs near UV region. Cotton effect curves are mainly classified into two types:
- Single cotton effect curve
- Multiple cotton effect curve
- Single cotton effect curve
At maximal absorption, the cotton effect curve exhibits both the maximum and the minimum curve. Positive cotton effect occurs when the crest first passes through the trough and moves toward the cotton effect region and negative cotton effect occurs when the trough moves first through the crest and moves toward the cotton effect region. The vertical distance between crest and trough is called amplitude.

2. Multiple cotton effect curve
Multiple cotton effect curve is the combination of a number of single cotton effect curves. It is more complex than a single cotton effect curve. This curve result from the electronic transition of many Chirotropic chromophore presents in a molecule.

Application of ORD curve
- It helps to determine the relative configuration of chiral compounds.
- It helps in the determination of Configuration and study of compound conformational change.
- It helps in the analysis of the functional group and determination of the position of the functional group.
- It helps in the structural determination of polypeptide and protein.

