Two-dimensional NMR (2D NMR) spectroscopy is an advanced spectroscopic method or technique in which spectra are generated that have signal intensity as a function of two frequency dimensions. In large molecules such as natural products, there is an overlap of a large number of peaks in 1D NMR spectra which makes spectra very complex and it makes analysis difficult. Therefore, to solve this problem, 2D NMR spectroscopy is used. Let’s discuss how 2D NMR spectra are generated and how it differs from 1D NMR.
Generation of 2D NMR spectra
In the 2D NMR technique, the spectra are generated by applying two radiofrequency pulses which are separated by an intervening time period( t1) known as the evolution period.
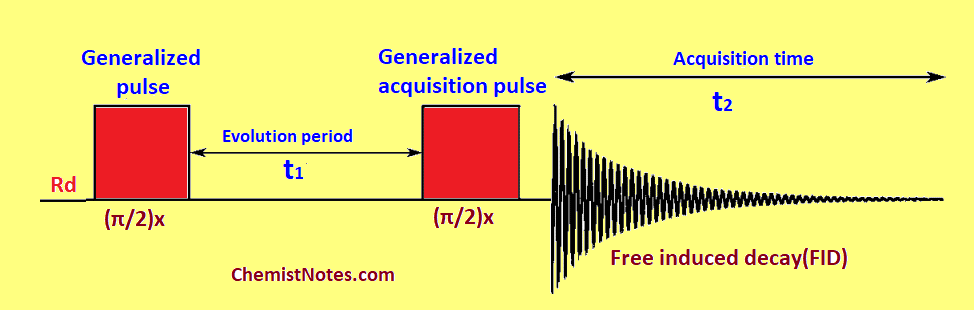
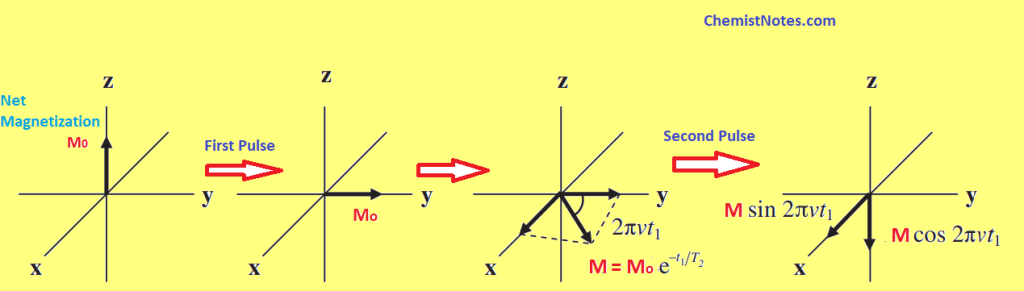
The first radiofrequency pulse (π/2)x, popularly known as generalized pulse or preparation pulse is applied along the x-axis which excites all the nuclei present in the sample that interacts with each other through spin-spin coupling, dipolar interactions, or by a range of other mechanisms during evolution time(t1). In another word, the first pulse along the x-axis rotates net magnetization Mo onto the y-axis to M (Mo is changed to M in the y-axis) as shown in the given figure. The Magnetization vector(M) can be resolved into two vector components along two axes. The y-component of M is M cos(2πνt1) and the x-component is M sin(2πνt1).
The second pulse which is also known as generalized acquisition pulse or mixing sequence (π/2)x is applied just after the evolution period(t1) along the x-axis. This pulse rotates the y-component downward onto the –z-axis, which doesn’t give free-induced decay(FID). But the x-component remains unchanged in the XY plane and gives the FID, which is measured in the acquire time or detection time(t2). This completes one cycle of measurement in which we obtain one FID.
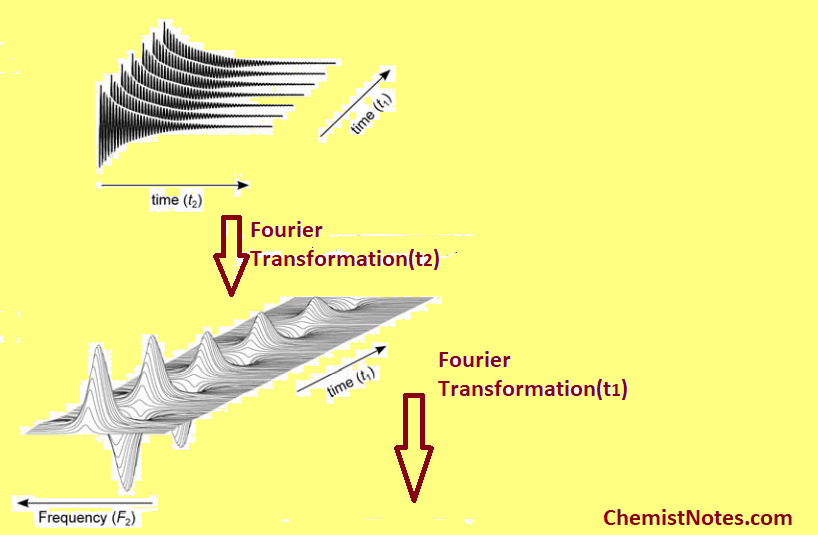
Now, the t1 is then incremented slightly and the process is repeated to acquire a new FID. In this way, the value of t1 is systematically incremented many times and separate FIDs are recorded for each value of t1 resulting in an array of FIDs.
The FID for each portion in the data set is subjected to a Fourier Transformation(FT) to give a new array having two dimensions, one of which is a frequency dimension(F2) and one is still a function of time(t1). A second Fourier transformation(FT) operation is carried out perpendicular to the first FT operation, converting the remaining time-dependent dimensions to the second frequency dimensions(F1).
Thus, in summary, in a 2D NMR experiment, there are four important periods in the pulse sequences which are used to acquire 2D NMR spectra. The pulse sequence is shown in the following figure.
- Relaxation period(Rd)
- Generalized pulse( First Pulse)
- Evolution time(t1)
- Generalized acquisition pulse( Second pulse)
- Acquisition time(t2)
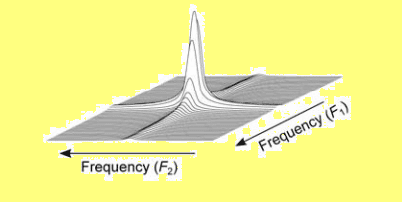
Two-dimensional NMR spectra may be represented in several ways but the most common are the Stacked plots and Counter plots.
- Stacked plot: In this plot, the chemical shift values in the F2 and F1 dimensions are represented on two separate axes and the vertical axis show signal intensity.
- Counter plot: This one is common, and this is actually a topographical map of the stacked plot.
Types of 2D NMR experiments
The most important 2D NMR experiments for solving structural problems are listed below.
- COSY(Correlation spectroscopy)
- NOESY( Nuclear Overhauser Effect Spectroscopy)
- HMQC(Heteronuclear Multiple Quantum Correlation)
- HMBC( Heteronuclear Multiple Bond Correlation)
- INADEQUATE( Incredible Natural Abundance Double Quantum Transfer Experiment)
- HSQC(Heteronuclear Single Quantum Correlation)
Difference between 1D and 2D NMR spectroscopy
In 1D NMR spectra, the signal is presented as a function of a single parameter, chemical shift. In 2D NMR spectra, there are two coordinate axes of chemical shifts, and the signal is presented as a function of two chemical shift values ( frequency dimensions).
In 1D pulsed NMR spectroscopy, only one 90° excitation pulse is applied followed immediately by data acquisition. But in 2D NMR, two pulses separated by evolution time are applied. In a generalized way, we can say that there is no evolution time in 1D NMR spectroscopy but the evolution period is there in between the two radiofrequency pulses.