Growth curve analysis is a simple and interesting process of study the different phases during the growth and development of organism. By clearly modeling change over time and measuring both group-level and individual-level differences, growth curve analysis offers a solution to these problems.
The curve can be used to identify different growth cycle stages. Additionally, it makes it easier to quantify an organism’s cell count and rate of growth under controlled conditions as shown by the generation time, or the amount of time needed for a microbial population to double.
Growth Curve Analysis
The term “growth curve” refers to a curve in biology that depicts the variation in the number of cells (or single-celled organisms) in an experimental culture over time. The rise and decrease of populations of plants, animals, and other multicellular creatures through time is tracked using growth curves, which are frequently used tools in ecological research.
Bacterial growth curve analysis
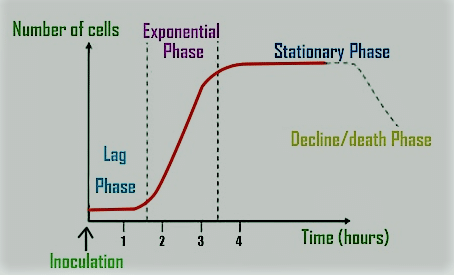
Generally growth curve analysis includes four different phases. They are discussed below:
- Lag phase
This is the first initial phase of growth curve in which bacteria starts to feed on the nutrients, media or simply the food and the amount of population and overall growth is decreasing thats why the process is called lag phase. Metabolic activity but not growth are often characteristics of this first phase of cell development. The media are used by the cells to produce the tiny molecules required for replication. The cells start to grow in size at this stage, albeit not necessarily in quantity.
2. Log phase ( exponential phase)
This is the second process and in this process slowly, the bacteria after feeding starts to reproduce and increases their number so-called as log phase. The process of increasing the number of bacterial cells. The population’s cell count rises by a factor of two with each generation in the log phase (also known as the exponential or logarithmic phase). An exponentially growing colony of bacteria has a modest initial growth before exploding in size.
3. Stationary phase
This is the most important phase of growth curve in which, after reproducing its number, they starts to producing secondary metabolites used for different process which is not directly involve in life process. Due to a growth-restraining cause, such as the depletion of an important nutrient or the production of an inhibitory product, cell proliferation slows down, resulting in a state in which the rates of cell growth and mortality are equal. At this point, cells are most vulnerable to damage.
4. Death phase
This phase include decline of bacterial cell also called death phase or in this process bacteria starts to decline. The death phase, the last stage of the growth curve, is marked by a net loss of culturable cells. Even while some cells may still be metabolizing and dividing during the death phase, there is a net loss of viable cells because more viable cells are lost than are gained.
Different phases of growth curve
The different phases of growth curve analysis was already discussed above.
- Lag phase
- Log phase
- Stationary phase
- Death phase
Metabolites formation during stationary phase
Secondary metabolite formation by bacteria begins during the stationary phase as a result of nutritional deficiency or in reaction to environmental stress. Although it is not necessary for bacterial development, secondary metabolite production enables them to interact with their ecological environment more effectively.
Principle of growth curve
Rather than their cell size increasing, bacteria develop by multiplying, which is known as bacterial growth. These bacterial cells multiply exponentially; one cell multiplies into two, then four, then eight, then sixteen, and so on.
Importance of Growth curve analysis
Differential effects of medium, genetics, and stress on microbial population development are studied using microbial growth curves. As a result, there are several modeling frameworks available to record measures of microbial population expansion. The population growth curve shows how the population has increased through time. An exponential growth curve looks like this. Depending on the population pieces provided, growth curves might be linear, exponential, or cubic.