The ladder diagram is a basic graphical tool for assessing the chemistry occurring during a reaction or analysis. It is basically used to determine what reactions occur when many reagents are combined, estimate the approximate composition of a system at equilibrium, and evaluate how a change in solution conditions may alter our conclusions.
Ladder Diagrams for Acid-Base Equilibria
In context to acid-base equilibria, a ladder diagram helps to understand the interactions and behavior of acids and bases in a chemical system. It assists in interpreting the balance of reactants and products, as well as how external variables might impact this equilibrium.
Let us consider a reaction:
HF(aq) + H2O(l) ⇌ H3O+(aq) + F–(aq)
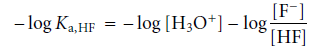
The acid dissociation constant for this reaction is
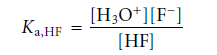
Taking the log of both sides and multiplying by -1 results in
Moreover, rearranging and replacing the negative log terms with p-functions results
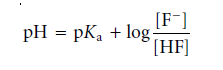
This equation explains the link between pH and the relative amounts of F– and HF in equilibrium. If the F– and HF concentrations are equivalent, the equation reduces to
pH = pKa,HF = –log(Ka,HF) = –log(6.8 ×10⁻⁴) = 3.17
The log term in the above equation is positive for F– concentrations greater than HF concentrations
pH > pKa,HF or pH > 3.17
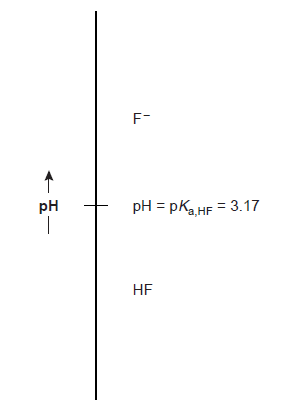
This is a probable outcome because the concentration of hydrofluoric acid’s conjugate base, F–, is expected to increase when the pH rises. Similar reasoning demonstrates that the concentration of HF exceeds the concentration of F– when
pH < pKa,HF or pH < 3.17
Now, in regards to constructing a ladder diagram, the pH values in the ladder diagram are arranged vertically, with lower (more acidic) pH values at the bottom and bigger (more basic) pH values at the top. At pKa,HF equal to pH, a horizontal line is drawn. The solution is divided into areas where each of the two conjugate forms of HF predominates by this line or step. We can see from the ladder diagram that hydrofluoric acid will mostly exist as HF at a pH of 2.5. The predominant form changes to F– when we add enough base to the mixture to raise the pH to 4.5.
Ladder Diagrams for Complexation Equilibria
For equilibria involving metal-ligand complexes, the same principles that guide the construction and interpretation of ladder diagrams for acid-base equilibria can be employed. The concentration of uncomplexed, or free, ligand, pL, determines the ladder diagram’s scale for complexation reactions.
Cd2+(aq) + NH3(aq) ⇌ Cd(NH3)2+(aq)
The dividing line between the predominance regions for Cd2+ and Cd(NH3)2+ is log(K1).
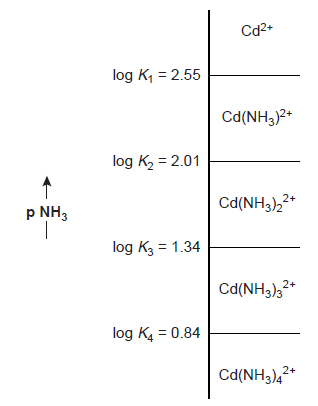

K1 for Cd(NH3)2+ is 3.55’102; hence, log(K1) = 2.55. Thus, Cd2+ is the dominant species when pNH3 is greater than 2.55 (NH3 concentrations below 2.8 ×10⁻³ M). Figure on the right side displays a complete ladder diagram for the Cd2+ and NH3 metal-ligand complexes.
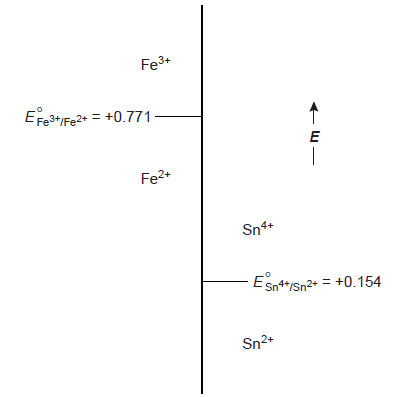
Ladder Diagram for Oxidation-Reduction Equilibria
Using ladder diagrams, one may assess equilibrium redox system reactions. A typical ladder diagram for two half-reactions is shown below, using the electrochemical potential, E, as the scale. The Nernst equation identifies areas of dominance. With reference to the Fe3+/Fe2+ half-reaction, we write
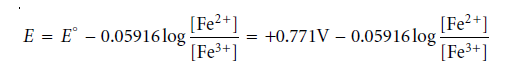
Fe3+ is the dominant species for potentials more positive than the standard-state potential, whereas Fe2+ is the dominant species for potentials more negative than E°. We can see that Sn2+ can diminish Fe3+ when combined with the phase for the Sn4+/Sn2+ half-reaction. The potential of the resulting solution will be close to +0.154 V if too much Sn2+ is added.